How to visualize optimizer histories#
Estimagic’s criterion_plot can visualize the history of function values for one or multiple optimizations.
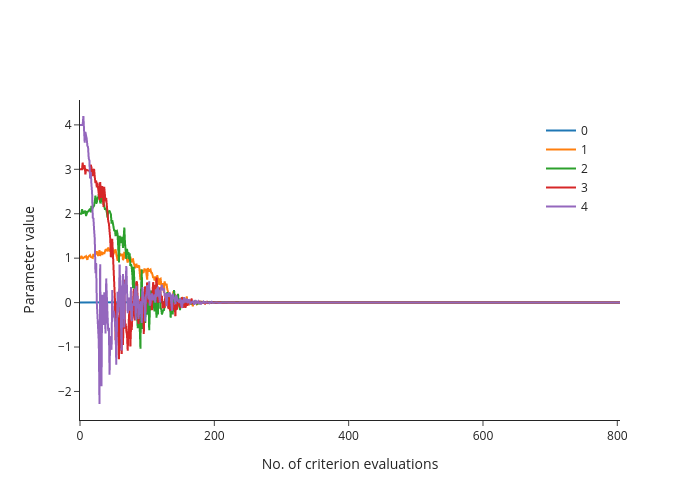
Estimagic’s params_plot can visualize the history of parameter values for one optimization.
This can help you to understand whether your optimization actually converged and if not, which parameters are problematic.
It can also help you to find the fastest optimizer for a given optimization problem.
import estimagic as em
import numpy as np
Run two optimization to get example results#
def sphere(x):
    return x @ x


results = {}
for algo in ["scipy_lbfgsb", "scipy_neldermead"]:
    results[algo] = em.minimize(sphere, params=np.arange(5), algorithm=algo)
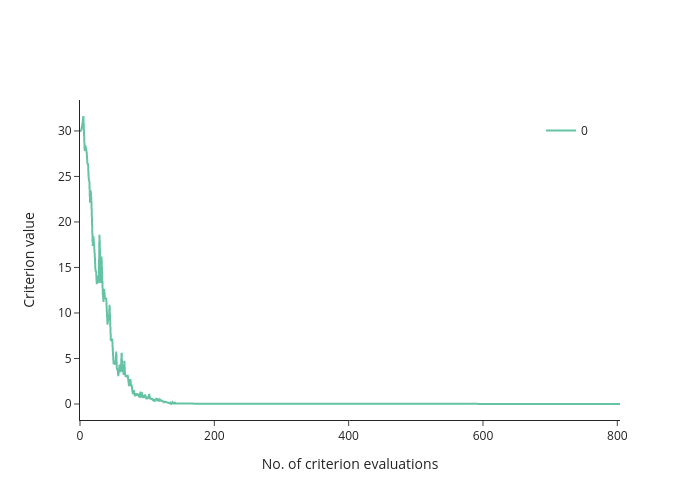
Make a single criterion plot#
fig = em.criterion_plot(results["scipy_neldermead"])
fig.show(renderer="png")
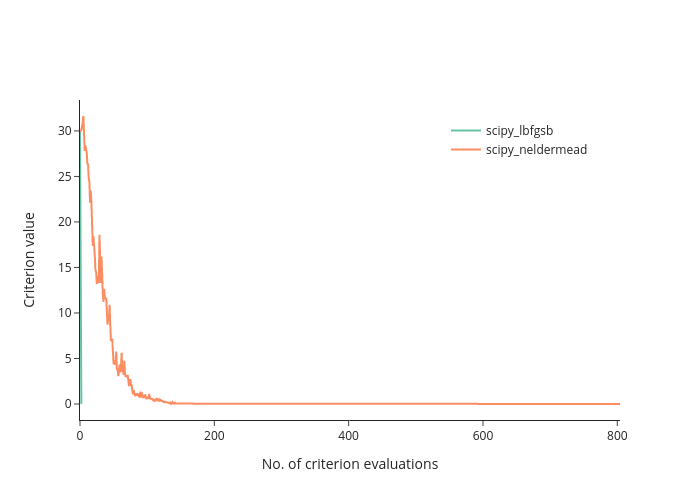
Compare two optimizations in a criterion plot#
fig = em.criterion_plot(results)
fig.show(renderer="png")
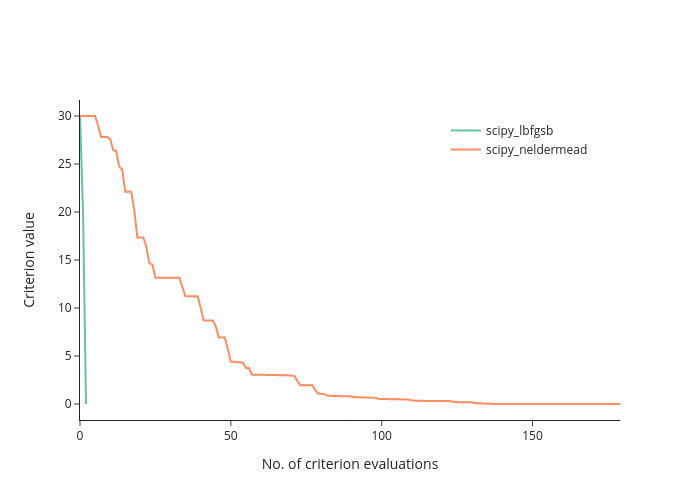
Use some advanced options of criterion_plot#
fig = em.criterion_plot(
    results,
    # cut off after 180 evaluations
    max_evaluations=180,
    # show only the current best function value
    monotone=True,
)
fig.show(renderer="png")
Make a params plot#
fig = em.params_plot(results["scipy_neldermead"])
fig.show(renderer="png")
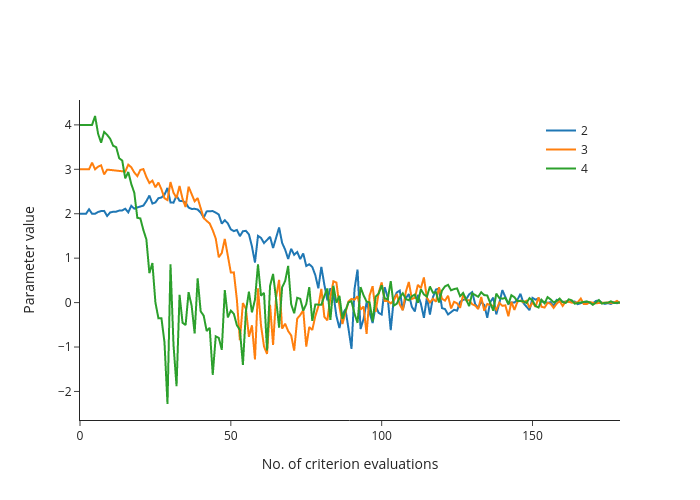
Use advanced options of params plot#
fig = em.params_plot(
    results["scipy_neldermead"],
    # cut off after 180 evaluations
    max_evaluations=180,
    # select only the last three parameters
    selector=lambda x: x[2:],
)
fig.show(renderer="png")
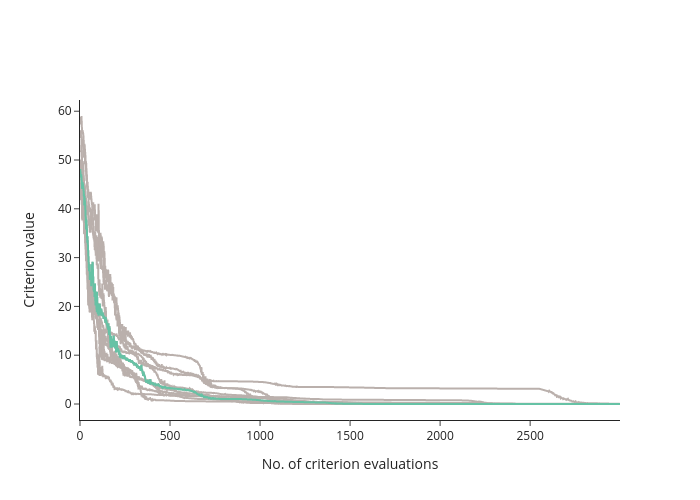
criterion_plot with multistart optimization#
def alpine(x):
    return np.sum(np.abs(x * np.sin(x) + 0.1 * x))


res = em.minimize(
    sphere,
    params=np.arange(10),
    soft_lower_bounds=np.full(10, -3),
    soft_upper_bounds=np.full(10, 10),
    algorithm="scipy_neldermead",
    multistart=True,
    multistart_options={"n_samples": 1000, "convergence.max_discoveries": 10},
)
fig = em.criterion_plot(res, max_evaluations=3000)
fig.show(renderer="png")