How to use the dashboard#
Overview#
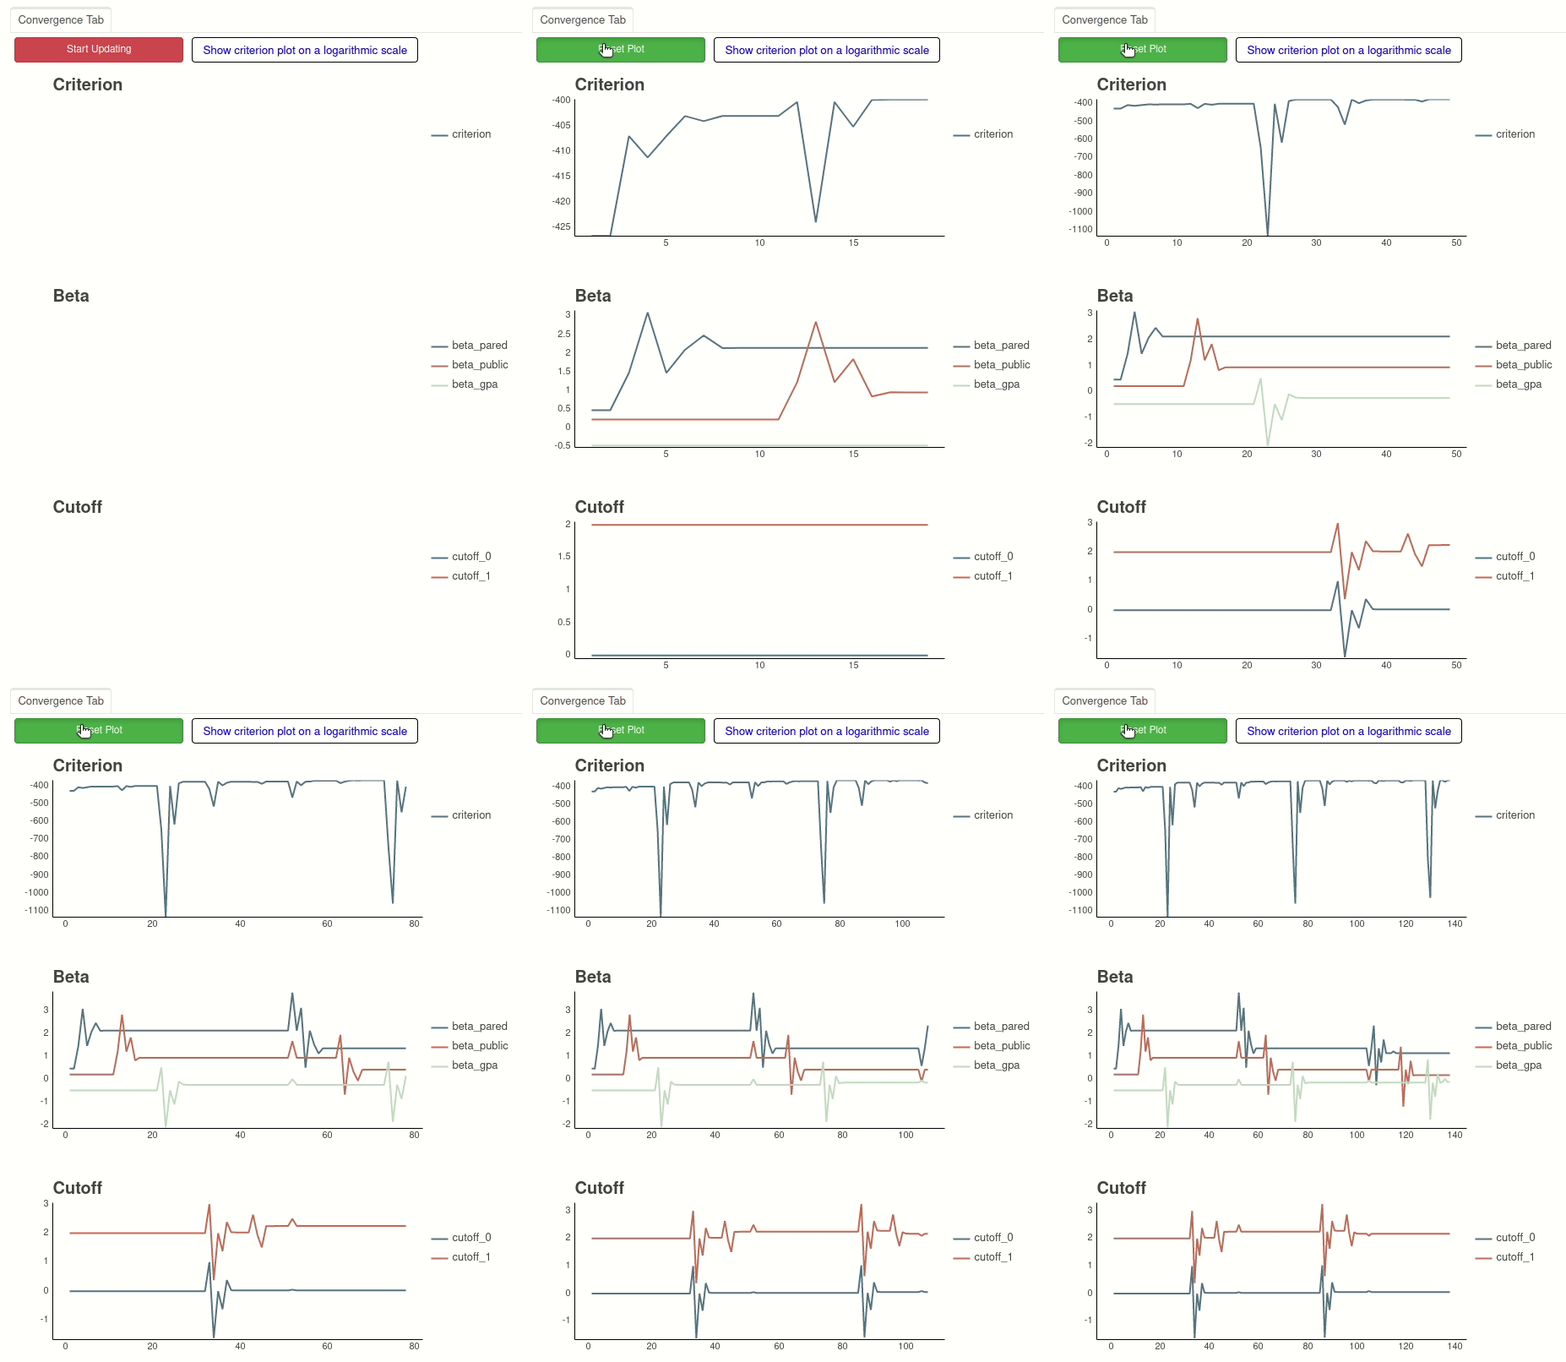
Estimagic provides a dashboard that allows to inspect an optimization. The dashboard visualizes the database created and updated by an optimization. You can start a dashboard by typing the following in your command-line interface:
$ estimagic dashboard db1.db
You can configure the behavior of the dashboard with additional command line arguments.
To get a list of all supported arguments type estimagic dashboard --help :
Usage: estimagic dashboard [OPTIONS] DATABASE_PATH

Start the dashboard to visualize optimizations.

Options:
-p, --port INTEGER        The port the dashboard server will listen on.
--no-browser              Don't open the dashboard in a browser after
                            startup.

--jump                    Jump to start the dashboard at the last rollover
                            iterations.

--rollover INTEGER        After how many iterations convergence plots get
                            truncated from the left.  [default: 10000]

--update-frequency FLOAT  Number of seconds to wait between checking for new
                            entries in the database.  [default: 1]

--update-chunk INTEGER    Upper limit how many new values are updated from
                            the database at one update.  [default: 20]

--stride INTEGER          Plot every stride_th database row in the
                            dashboard. Note that some database rows only
                            contain gradient evaluations, thus for some values
                            of stride the convergence plot of the criterion
                            function can be empty.  [default: 1]
When started, the dashboard will open a page monitoring the evolution of the criterion value and parameters.

Grouping Parameters into Plots#
For optimization problems with many parameters, you should group parameters such that:
Not too many parameters are displayed in a single plot
All parameters in one plot have a similar order of magnitude
To do so, you can add a "group" column to your params DataFrame. Parameters that
belong to the same group, are displayed in the same plot. Null values like None,
np.nan and False in the group column mean that the parameter is not displayed in the
dashboard.
On a remote server#
Since estimagic is designed for long running optimizations, it is often run on large
remote servers. Normally, these servers do not offer a GUI or browser.
Nevertheless, you can display the dashboard in your local browser. To do so, you have to create an ssh tunnel. All the steps are identical to tunneling a jupyter notebook via ssh.
For the following we assume that you have already started an optimization on the server
(which can be terminated or still running) and the log was saved in your.db.
Open Bash, Powershell, CMD or Terminal.
Listen to a port on which the dashboard will send its data, e.g. 10101
ssh -N -f -L localhost:10101:localhost:10101 username@server-address
-Nprevents to commands on the remote,-fhides the connection in the background, so the console windows is not blocked,-Lis used to bind your local port to a remote port. At last, type your server user name and the server address separated with an@. You are asked to enter your password to establish the connection.Now, log into the remote server with
ssh username@server-addressand enter your password.
One the remote, launch the dashboard on the correct port and with the
--no-browseroptionestimagic dashboard your.db --no-browser --port=10101
Use a leading
&in a Bash or Powershell v6 Terminal to hide the task in the background. If your terminal is blocked, open another one.On your local machine, open a web browser and enter the address
localhost:10101.That’s it. For more information on
sshand how to configure your remote machine, check out Working remotely in shell environments.