How to use logging#
Estimagic can keep a persistent log of the parameter and criterion values tried out by an optimizer in a sqlite database.
The sqlite database is also used to exchange data between the optimization and the dashboard.
Turn logging on or off#
To enable logging, it suffices to provide a path to an sqlite database when calling maximize or minimize. The database does not have to exist, estimagic will generate it for you.
import estimagic as em
import numpy as np
def sphere(params):
    return params @ params
res = em.minimize(
    criterion=sphere,
    params=np.arange(5),
    algorithm="scipy_lbfgsb",
    logging="my_log.db",
)
Make logging faster#
By default, we use a very safe mode of sqlite that makes it almost impossible to corrupt the database. Even if your computer is suddenly shut down or unplugged.
However, this makes writing logs rather slow, which becomes notable when the criterion function is very fast.
In that case, you can enable "fast_logging", which is still quite safe!
res = em.minimize(
    criterion=sphere,
    params=np.arange(5),
    algorithm="scipy_lbfgsb",
    logging="my_log.db",
    log_options={"fast_logging": True},
)
Handling existing tables#
By default, we only append to databases and do not overwrite data in them. You have a few options to change this:
res = em.minimize(
    criterion=sphere,
    params=np.arange(5),
    algorithm="scipy_lbfgsb",
    logging="my_log.db",
    log_options={
        "if_database_exists": "replace",  # one of "raise", "replace", "extend",
        "if_table_exists": "replace",  # one of "raise", "replace", "extend"
    },
)
Reading the log#
reader = em.OptimizeLogReader("my_log.db")
Read the start params
reader.read_start_params()
array([0, 1, 2, 3, 4])
Read a specific iteration (use -1 for the last)
reader.read_iteration(-1)
{'rowid': 3,
 'params': array([ 0.00000000e+00, -2.19792136e-07, -4.01986529e-08, -1.26862247e-07,
        -2.06263028e-07]),
 'internal_derivative': array([ 1.49011612e-09, -4.38094157e-07, -7.89071896e-08, -2.52234378e-07,
        -4.11035941e-07]),
 'timestamp': 9886.792254106,
 'exceptions': None,
 'valid': True,
 'hash': None,
 'value': 1.08562981500731e-13,
 'step': 1,
 'criterion_eval': 1.08562981500731e-13}
Read the full history
reader.read_history().keys()
dict_keys(['params', 'criterion', 'runtime'])
Plot the history from a log#
fig = em.criterion_plot("my_log.db")
fig.show(renderer="png")
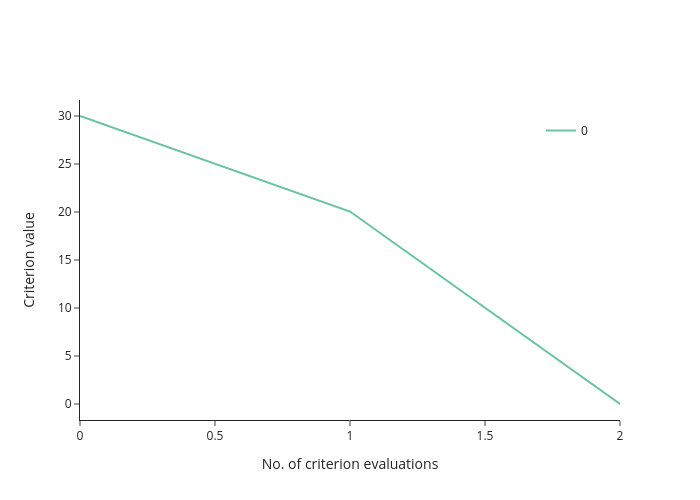
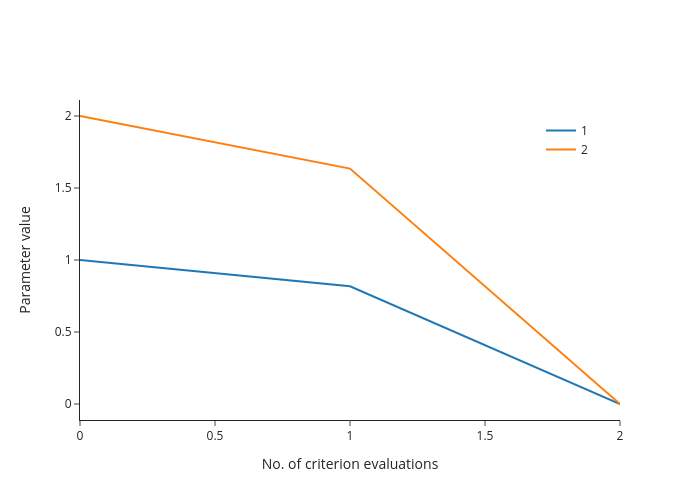
fig = em.params_plot("my_log.db", selector=lambda x: x[1:3])
fig.show(renderer="png")