How to plot derivatives#
In this guide, we show you how to plot numerical derivatives that were calculated using estimagic’s first_derivative function.
Why plot your derivatives?#
In estimagic, derivatives are mainly used to help in optimization. When an optimization process is stuck, it may be helpful in the debugging procedure to examine the derivative more closely.
Univariate functions#
The function derivative_plot works on the dictionary returned by first_derivative. Note that this requires return_func_value and return_info to be set to True, and n_steps to be larger than 1.
import estimagic as em
import numpy as np
def sphere(params):
    return params @ params
fd = em.first_derivative(
    func=sphere, params=np.zeros(1), n_steps=4, return_func_value=True, return_info=True
)
fig = em.derivative_plot(fd)

fig = fig.update_layout(width=800, height=500)
fig.show(renderer="png")
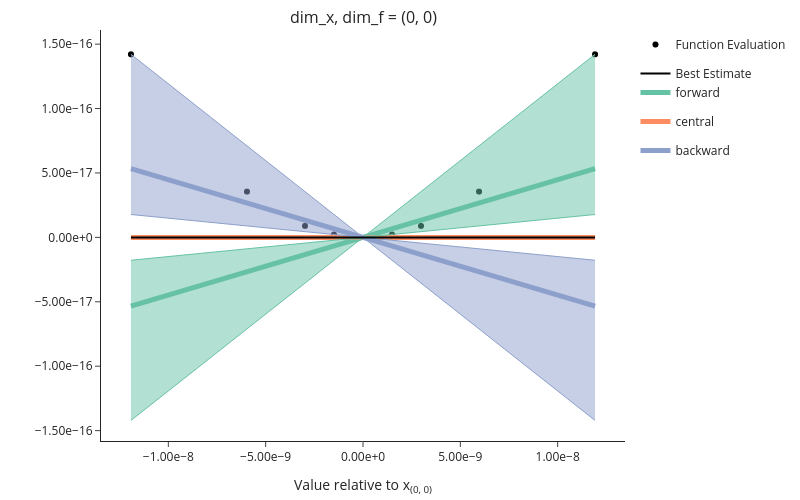
Description:#
The figure visualizes the function evaluations, the best estimate of the derivative, as well as forward, central and, backward derivative estimates. Forward and backward estimates come with bands that are calculated by applying the standard (forward/backward) formula on the smallest and largest possible steps. These bands are not confidence intervals, they shall merely give a rough overview as to where the true derivative may lie.
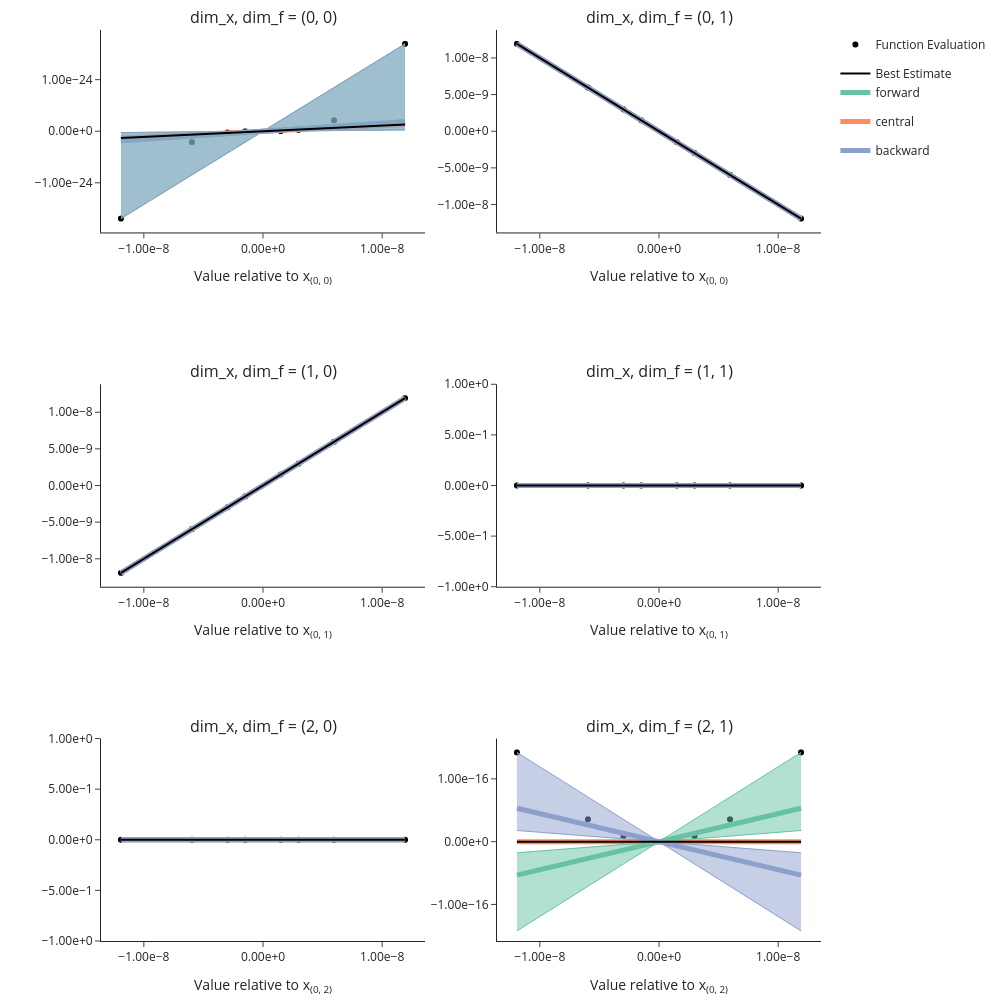
Multivariate functions#
def multivariate(params):
    y1 = params[0] ** 3 + params[1]
    y2 = params[2] ** 2 - params[0]
    return np.array([y1, y2])
fd = em.first_derivative(
    func=multivariate,
    params=np.zeros(3),
    n_steps=4,
    return_func_value=True,
    return_info=True,
)
fig = em.derivative_plot(fd)

fig = fig.update_layout(height=1000, width=1000)
fig.show(renderer="png")